Infrastructure & Operations Dashboard
Agile KPI Reporting for Infrastructure & Operations Managers
Request a Demo
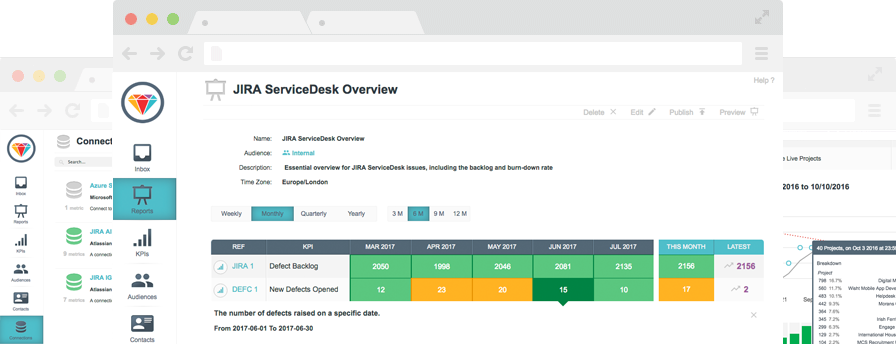
ServiceClarity Infrastructure & Operations reporting provides project managers with real-time reports on best-practice KPIs
Automated KPI Reporting
The ServiceClarity KPI Dashboard is a business value reporting tool for operations managers including TechOps, DevOps and service managers to measure the KPIs that matter from their cloud service metrics.
This powerful KPI dashboard enables infrastructure & operations managers to select best-practice KPIs, set targets and generate reports in order to understand the processes they need to improve. Highlighting what is working and what is not through simple KPIs, and by identifying why through drill-down analysis.

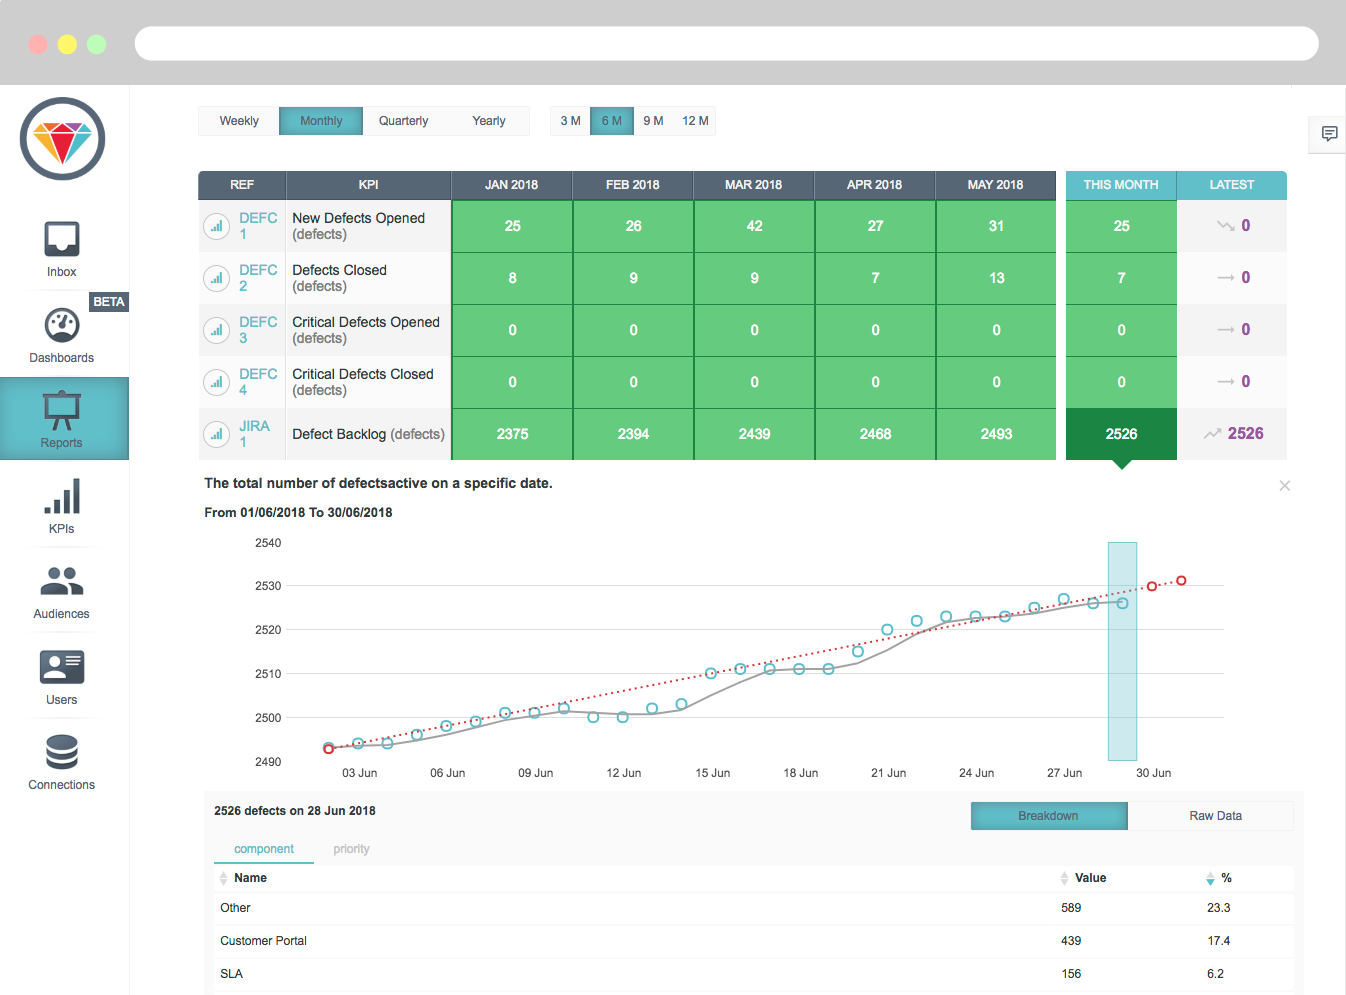
Measure the KPIs that matter
Rapidly growing technology companies increasingly rely on a multitude of cloud services to deliver their business.
To get to market quickly they combine Software-as-a-Service bug trackers, service desks, project trackers, log aggregators and monitoring tools along with cloud hosting and storage. These cloud services give businesses the agility to react quickly to market opportunities but create a challenge for the operational staff who manage them.
Senior executives and investors are demanding to know what is working and what is not but the range of cloud services makes this difficult. Only by measuring best practice KPIs across cloud services can processes be optimized to manage operational cost and increase profit.
ServiceClarity solves this problem by automating the reporting of best practice KPIs across cloud services so that senior executives can make strategic decisions.
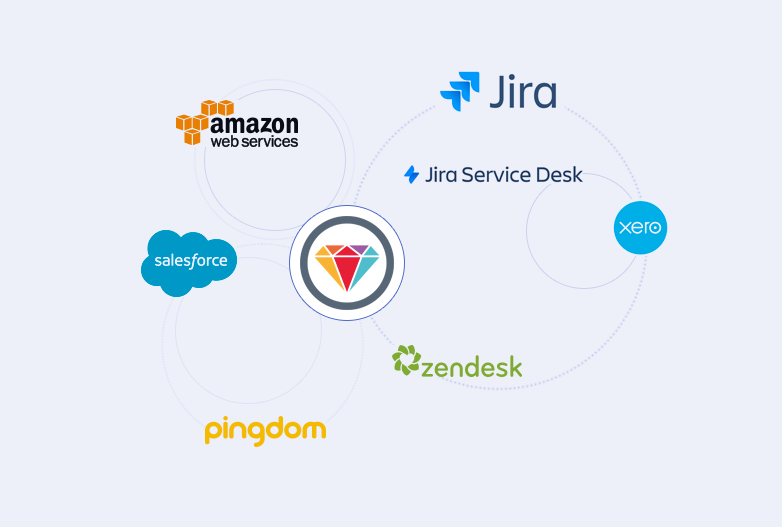
Report Across All Cloud Services
ServiceClarity integrates out-of-the-box with a broad range of cloud services including Jira, ServiceNow®, Amazon Web Services, Pingdom and many more. ServiceClarity’s unique cloud connector architecture and supporting services enables ServiceClarity to report KPIs from any cloud service or on-premise system within 2 weeks.
ServiceClarity unifies the reporting across Service Desks, CRMs, Project Trackers, Log Aggregators, Call Systems and Monitoring Tools.
For a full list of services supported out-of-the-box see the ServiceClarity Cloud Connectors list.
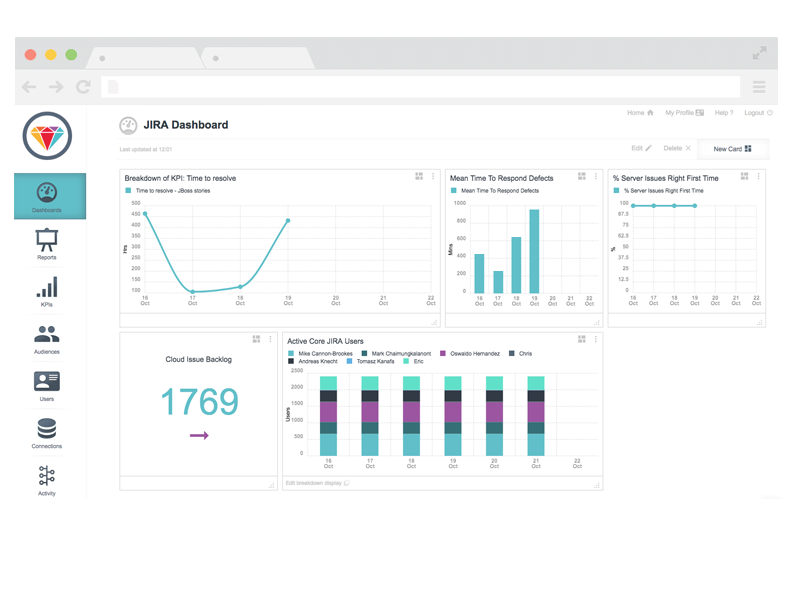
ServiceClarity for Jira
Automate infrastructure and operations reporting across all your JIRA projects.

ServiceClarity for your business
ServiceClarity dashboards enable companies to pinpoint the critical KPIs they must fine-tune to optimize the effectiveness of their business processes. Read our ServiceClarity Use Case to find out how.
Key Benefits
- – Improve development operations and customer satisfaction processes.
- – Improve and optimise business processes.
- – Make better strategic decisions.
- – Increase profits.
- – Empower decision makers & internal teams with meaningful reports.
Key Features
- – Powerful automated real-time KPI reporting tool.
- – Reports focus on agile software development, customer satisfaction and operations.
- – Track & measure KPIs that are custom to your data.
- – We connect into: Jira, ServiceDesk, AWS, Xero and many more.
- – Rapidly configure and monitor cloud and internal systems.
- – Provide dashboards for internal teams to monitor and track progress.
- – Share reports with internal teams and other stakeholders.
- – High-level KPI reporting with access to drill down into detail.
ServiceClarity
ServiceClarity is for technology leaders including Agile Delivery Managers, Agile Software Development & Customer Support Managers, and Executives in fast growing technology companies.
ServiceClarity dashboards enable companies to pinpoint the infrastructure and operations KPIs they must fine-tune to optimize the effectiveness of their business processes.
The design, development and operation of ServiceClarity are managed by Anaeko Ltd, www.anaeko.com.

CONTACT
10B Weavers Court
Business Park,
Belfast, BT12 5GH
e: info@serviceclarity.com
t: 028 90 236 742


![]()