Real-time KPI Reports for Jira
Monitor organisation performance against strategic goals with real-time KPI reports for Jira.
Watch our short overview video
Build out a KPI library with KPIs that matter to you and automatically publish to key stakeholders.
Report across all your Jira projects to track performance and optimise efficiency across software development and customer support
software development.customer support.
Start using Jira KPI dashboards in just 3 simple steps

CREATE
an account to securely access your reports

CONNECT
to Jira to authorise the collection of KPIs

REPORT
on your business performance with executive Jira KPI reporting
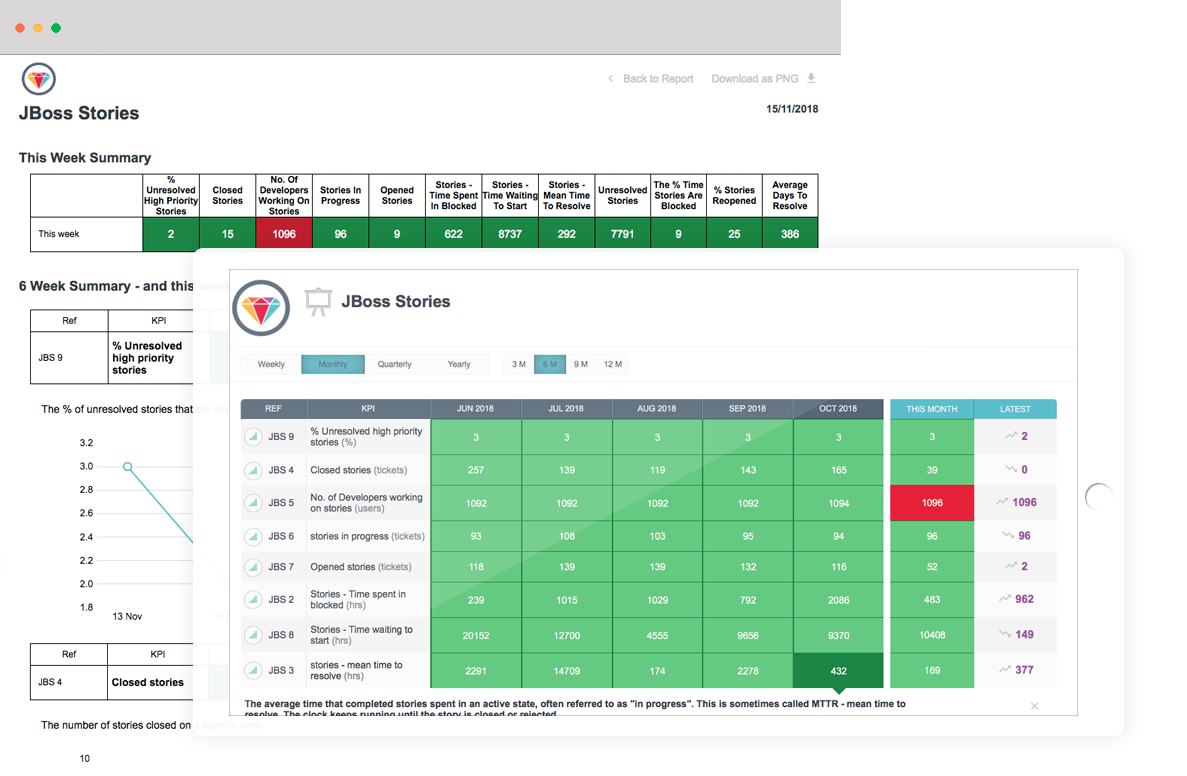
KPI Reports for Jira
 Software Quality Report
- % Time Spent Fixing Bugs
- Number of Bugs per User Story
- Average Time Spent in Test
- % Bugs Reopened
Bug Report
- Bug Burndown (Opened vs Closed)
- % Bugs Found Post Release
- % Critical Bugs
- Mean Time to Resolve Bugs
 Velocity Report
- Stories Opened vs Closed
- Bugs Found vs Fixed
- Story Points Closed
- Bugs Resolved
Remaining Effort Report
- Story Points Remaining
- Stories Remaining
- Bugs Remaining
- Days Remaining
 Cost Report
- Development Costs
- Testing Costs
- Bug Fix Costs
- Support Costs
Revenue Report
- % Time Chargeable
- Revenue
- Profit
- Lost Revenue
 Time Report
- % Time on User Stories
- % Time on High Priority Stories
- % Time on High Priority Bugs
- % Time on Unplanned Activities
Priority Report
- % of Senior Developer Time on High Priority Stories
- % of Senior Developer Time on High Priority Defects
 Customer Satisfaction Report
- First Time Fix
- First Line Fix
- % Defects Found by Customer
- Reopened Customer Issues
SLA Report
- % SLAs met
- Mean Time To Resolve
- Mean Time to Respond
- % Right First Time
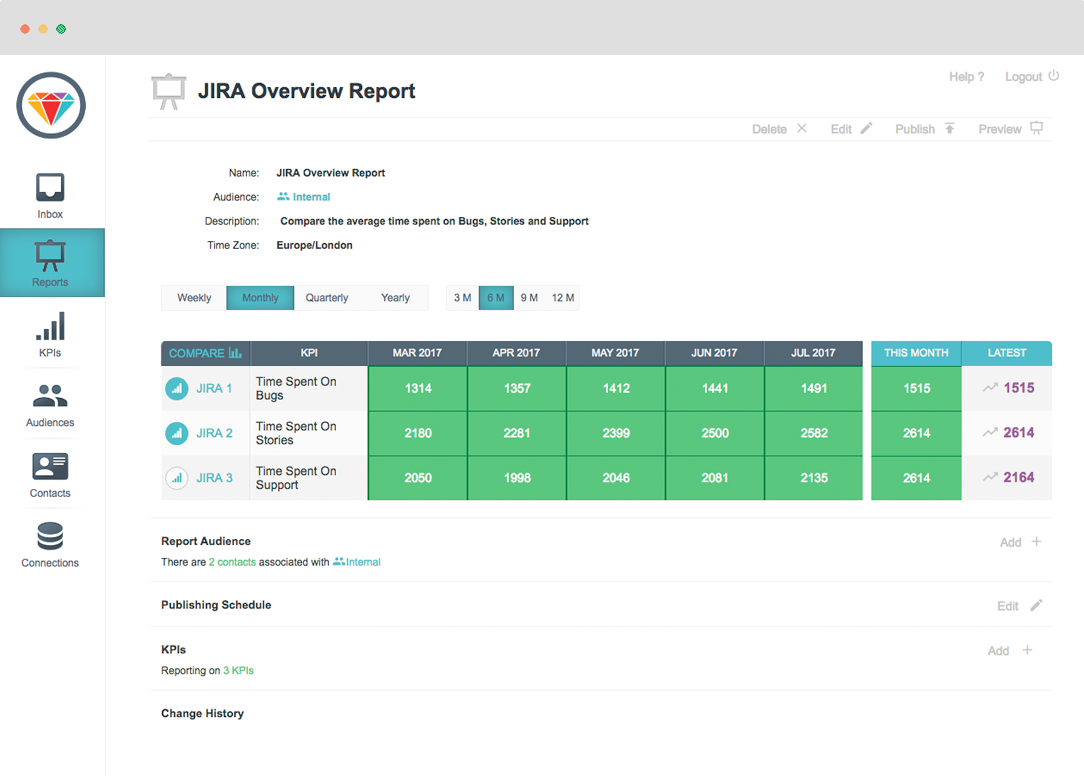
Report Across All Your Jira projects
Quickly compare time spent on development, feature and support tasks. Set targets and compare trends over time with historical breakdowns and performance.

KPI reports for Jira can track where you are spending your time across all your projects.
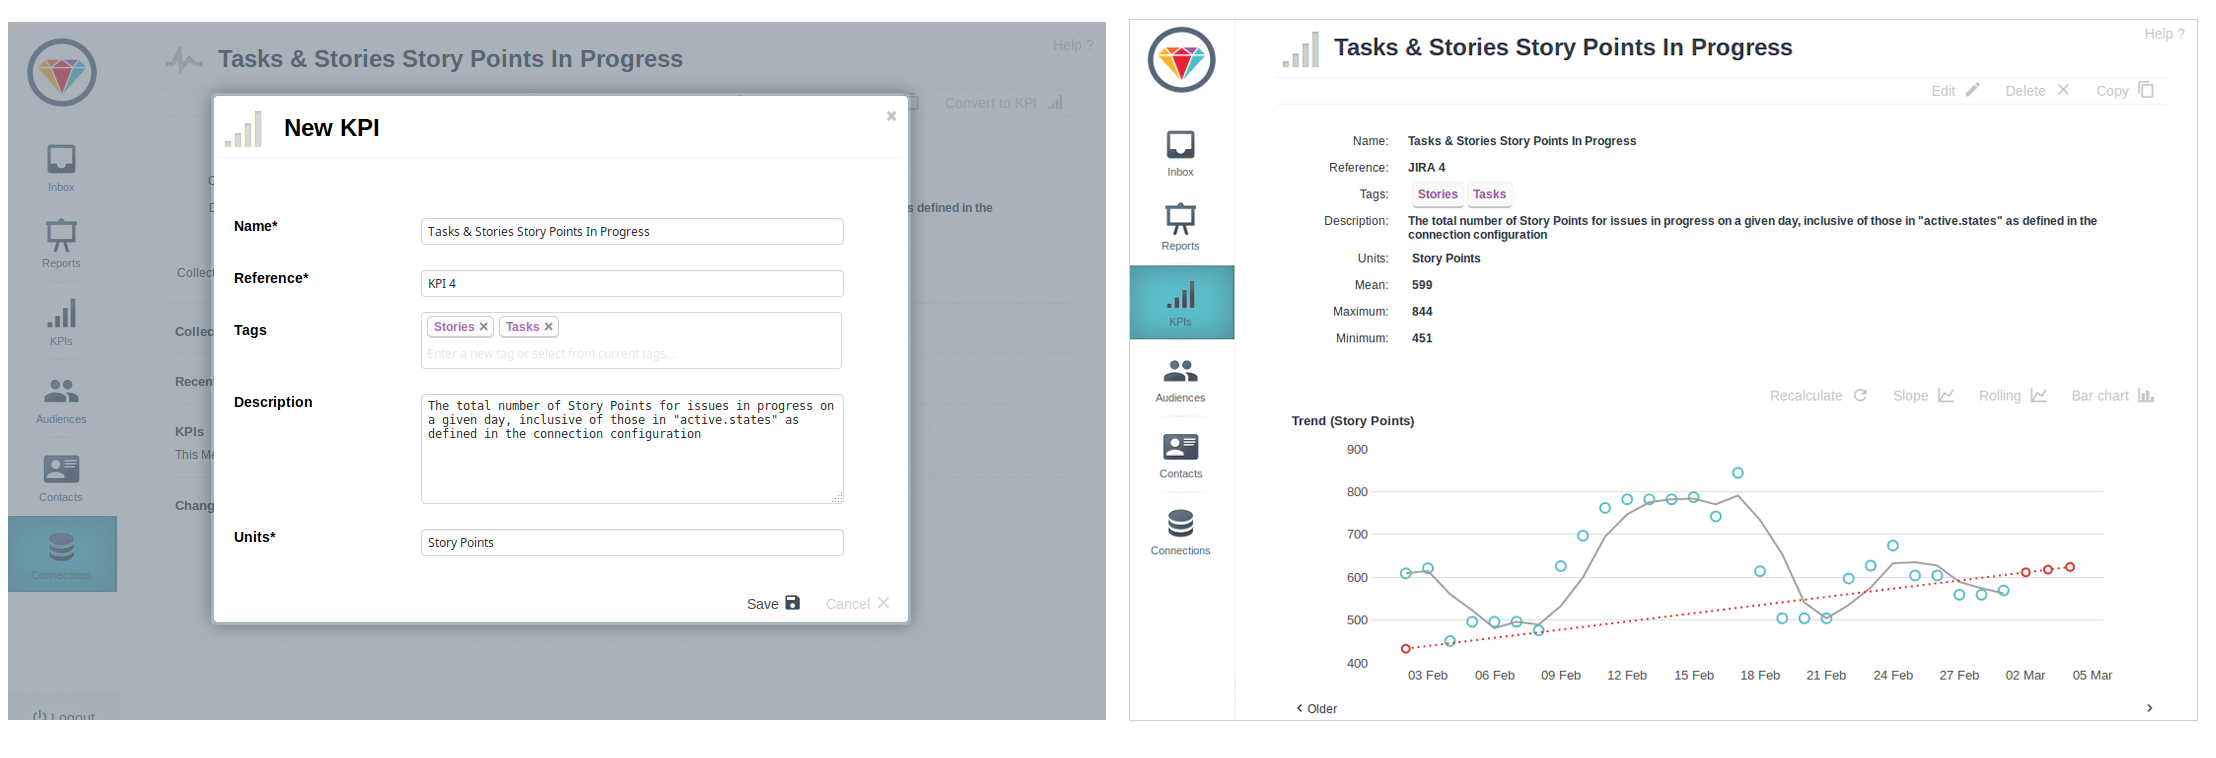
Jira KPIs
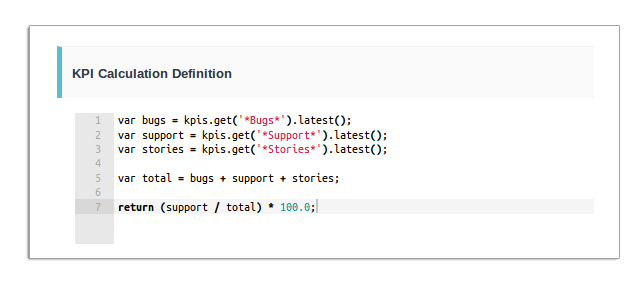
Customise your metrics to support your individual processes.
Executive KPI reporting with access to drill down into detail.
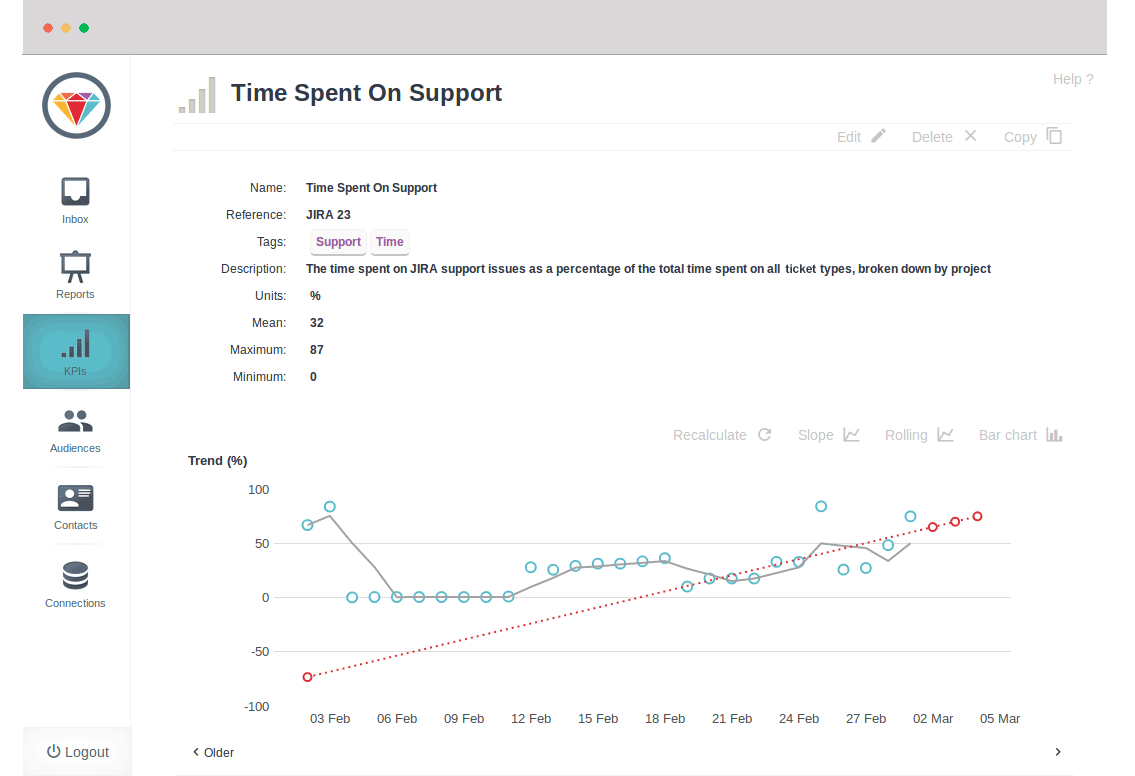
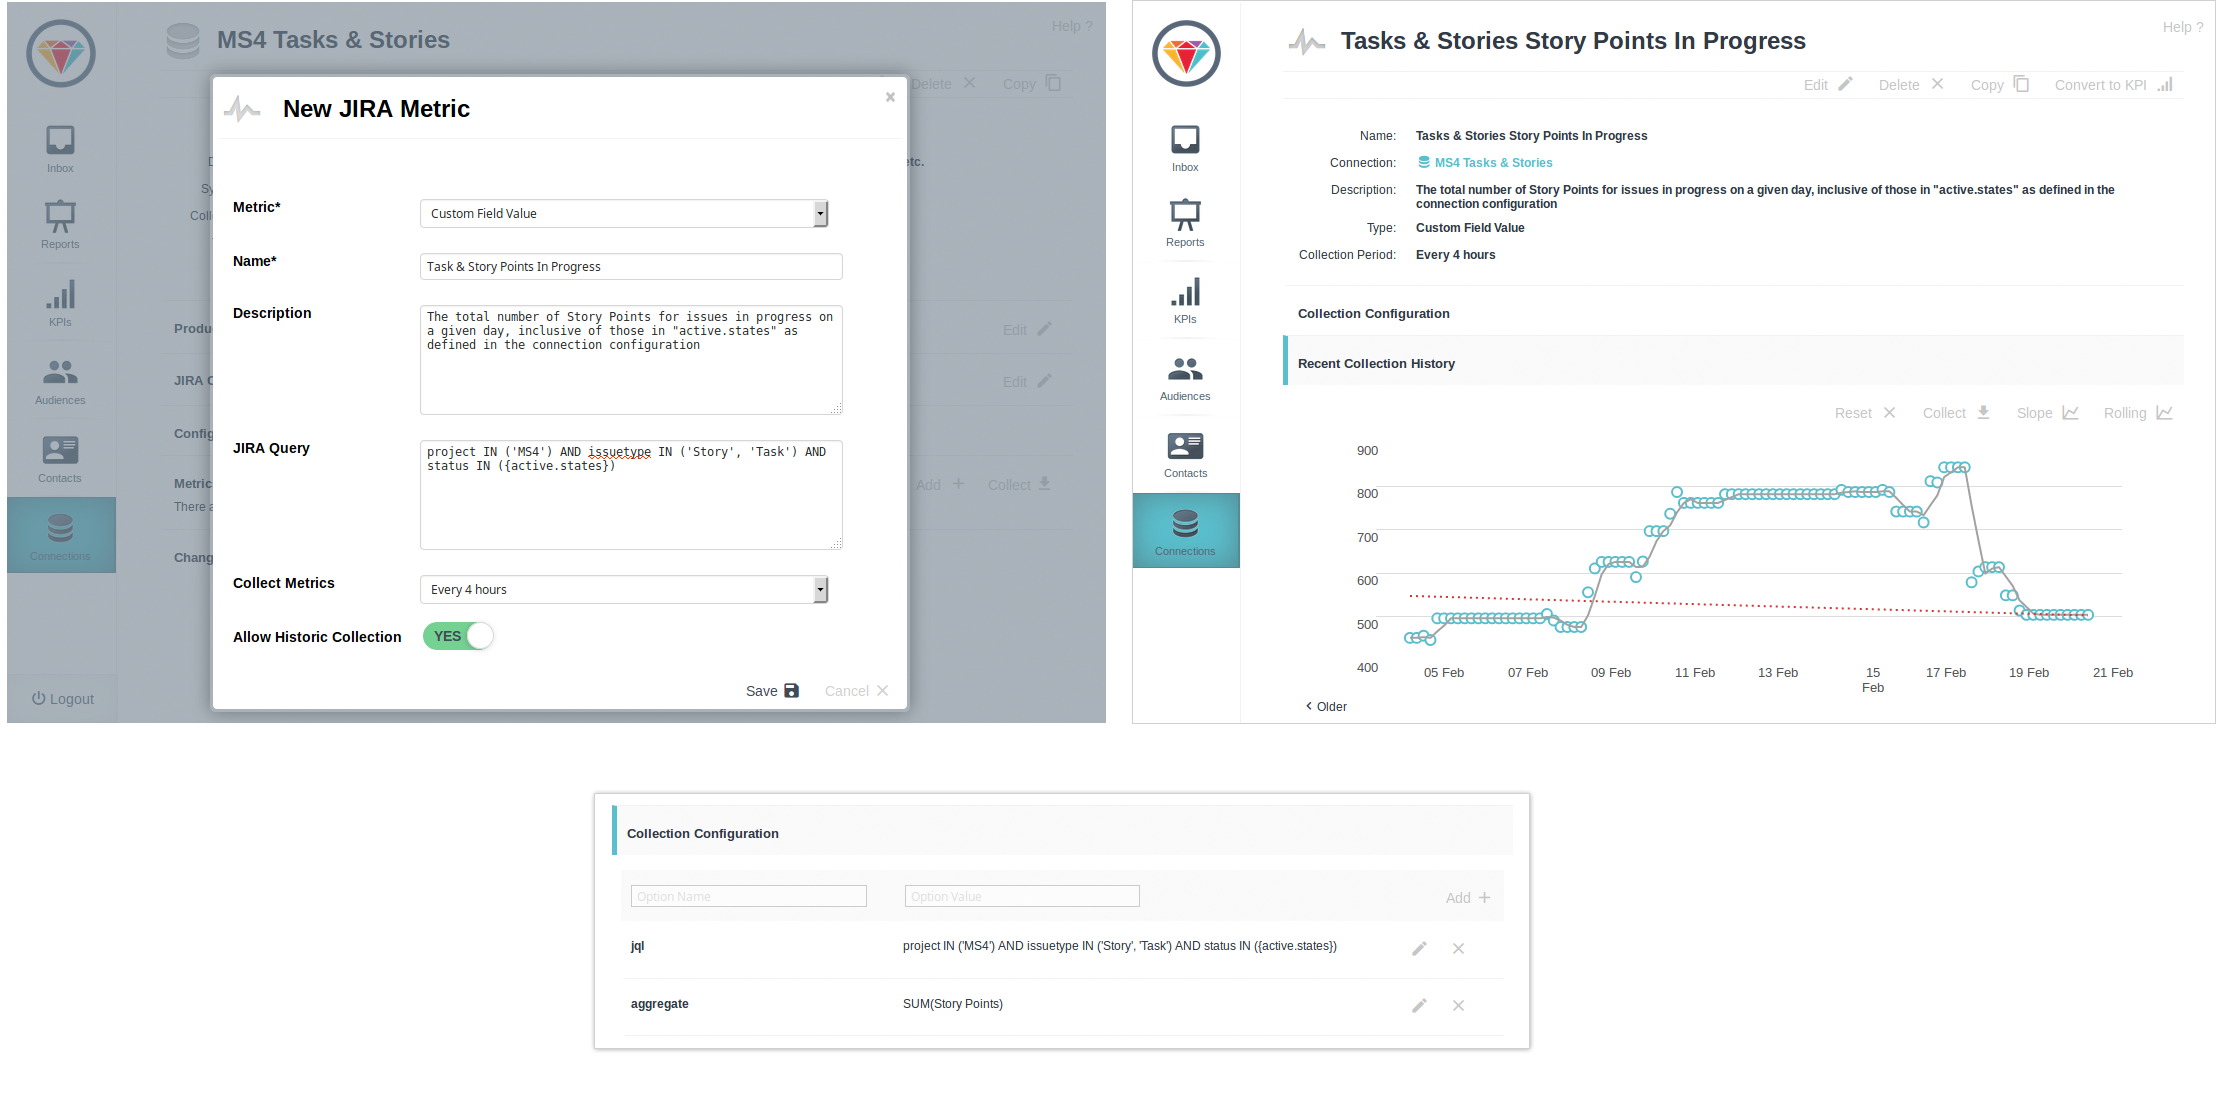
Detailed Jira Metrics
Make better strategic decisions.
Analyse your Jira projects with ServiceClarity to collect detailed metrics including timings, story points and priority.
Real-time analysis of labour utilisation and efficiency, drives projections of cost, release dates, and customer satisfaction.

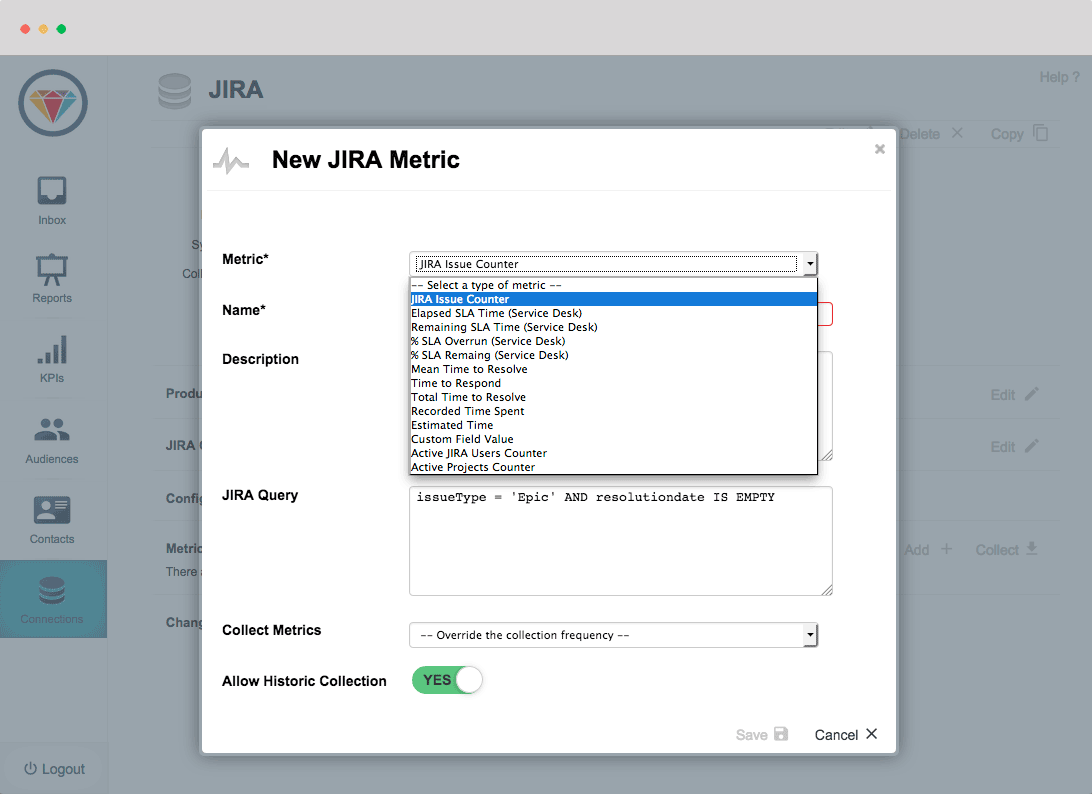
Find the Jira issues your interested in using familiar JQL query language.
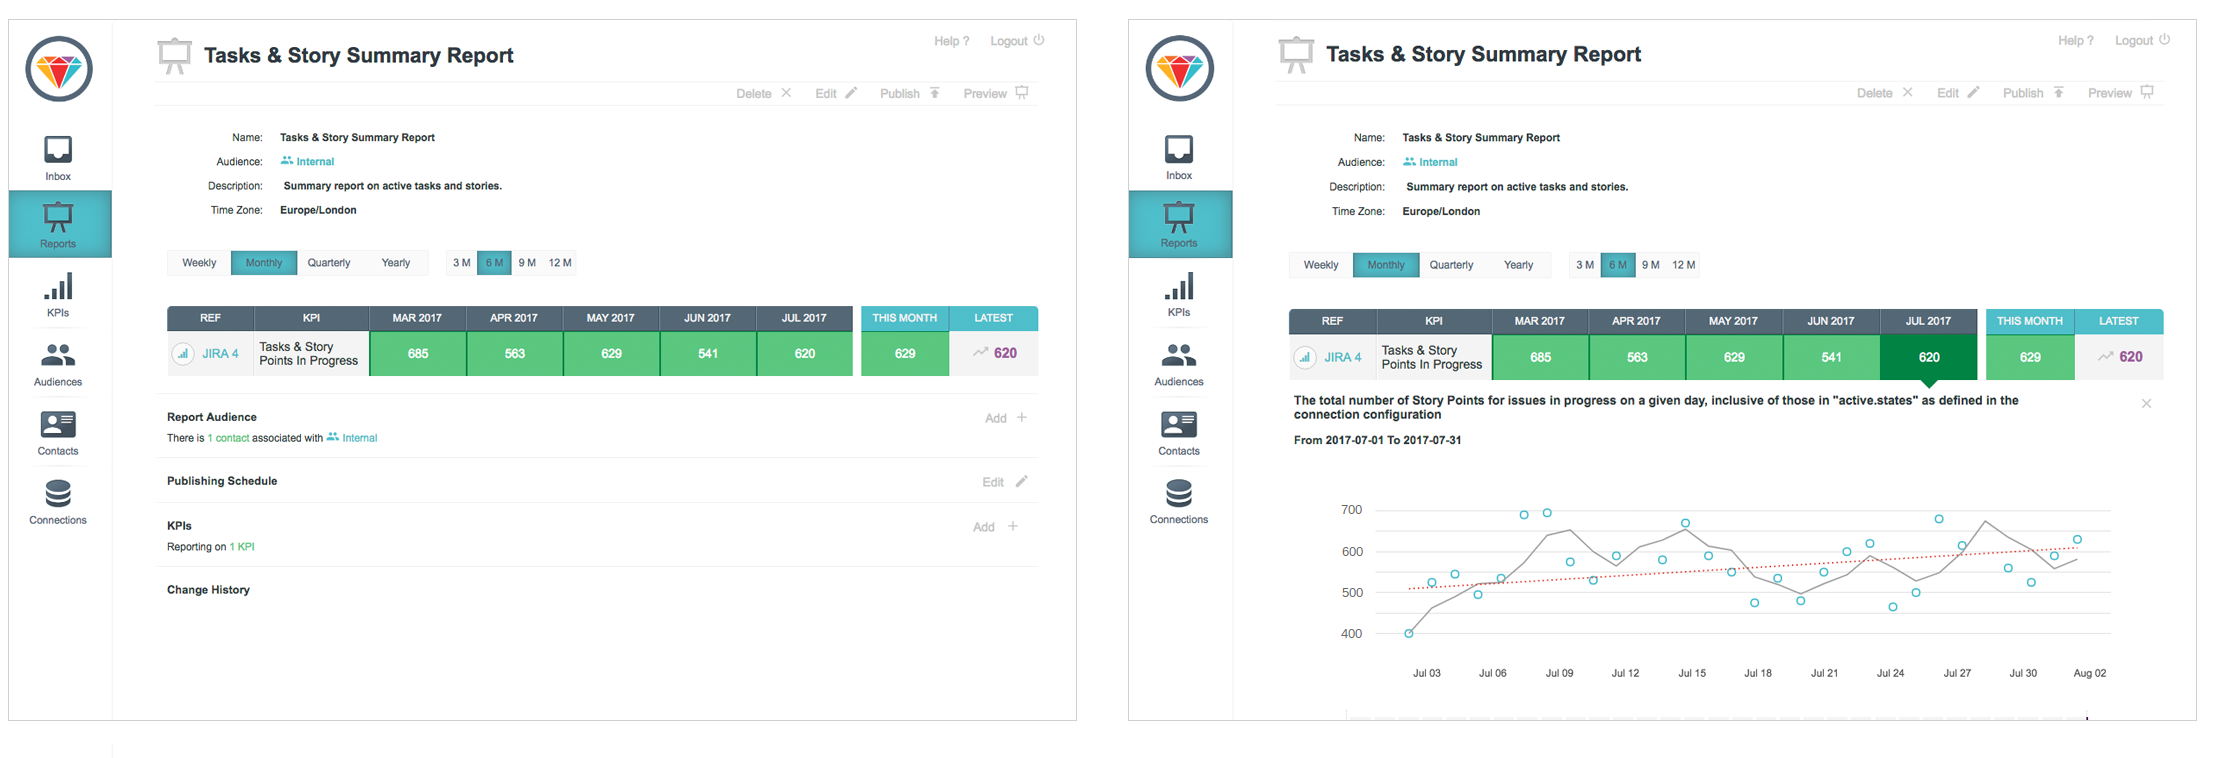
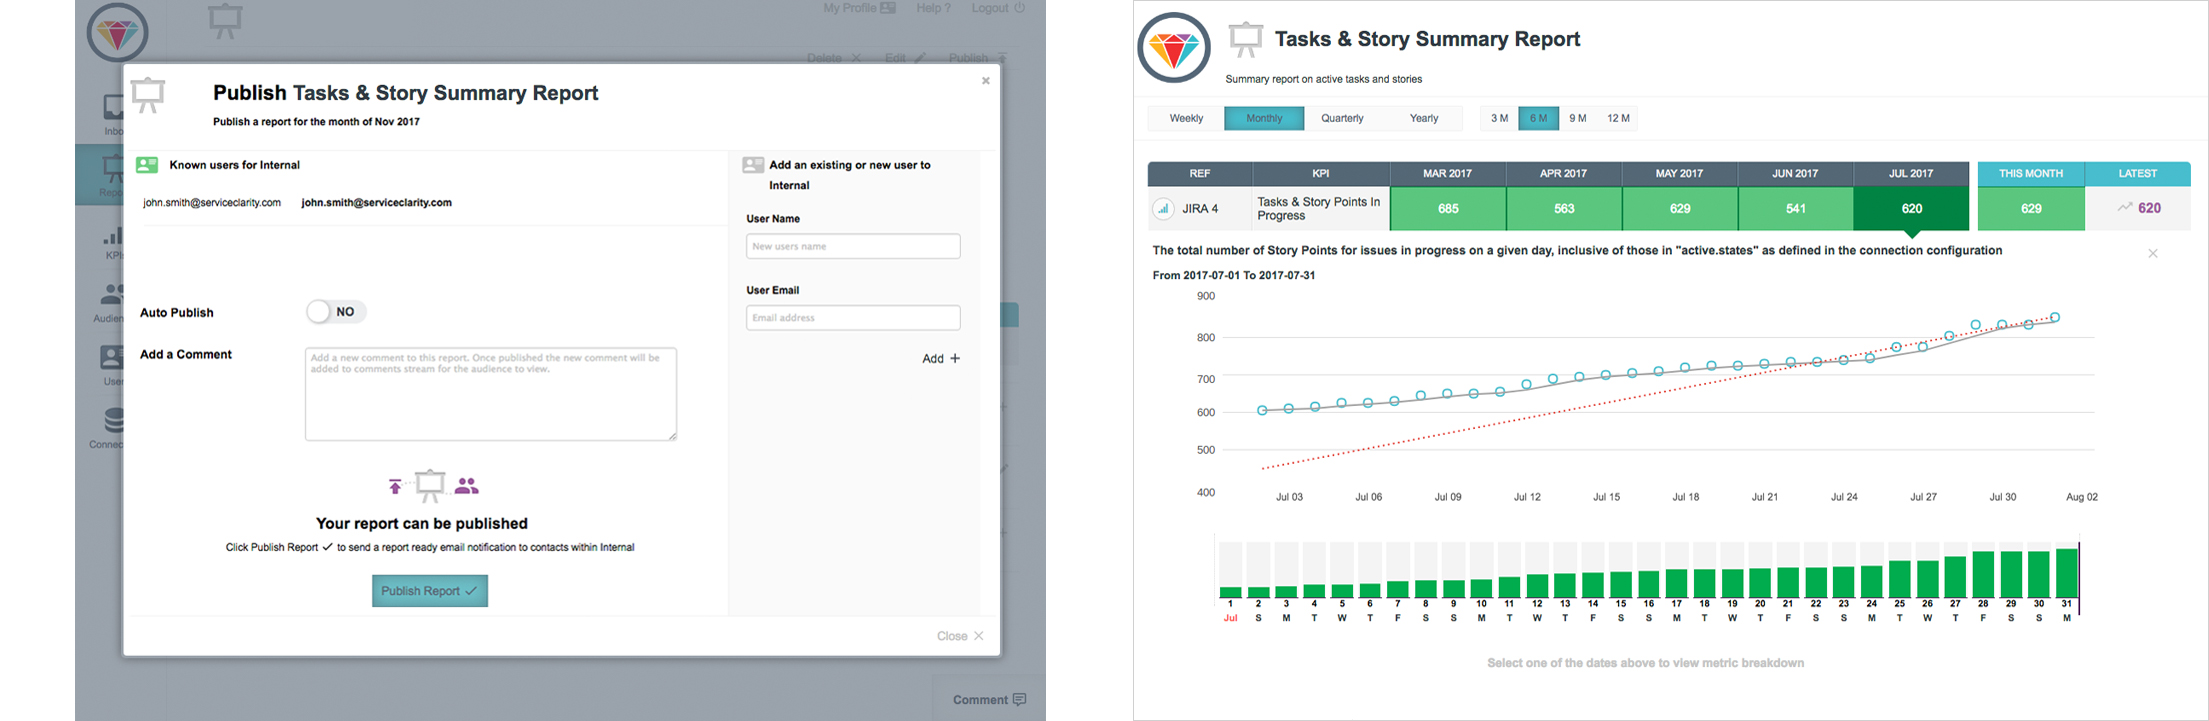
Sharing Reports
Empower decision makers & internal teams with meaningful reports.
Improve customer satisfaction by providing real-time KPI reports on the services you deliver. Share reports with customers or clients in a variety of ways:

Automatically publish to report audiences

Generate a sharable URL, view our shared report

Download and print

ServiceClarity was able to provide me with greater insights into JIRA than any other reporting tool on the market. Within 5 days I was able to get a report that was custom to my development processes and start monitoring straight away.
Dima Rastaturin
Head of Operations at Pindrop NL
With ServiceClarity we can see all of our key metrics all the time. We can also more clearly see the relationships between the numbers and how pulling different levers can have a significant impact on performance.
Andrew Fleury
CEO of Transpoco