JIRA KPI reporting

ServiceClarity for Agile Delivery Managers

Automate reporting of best-practice KPIs across Lean-Agile, SAFe® (Scaled Agile Framework®) and DevOps processes to deliver continual service improvements.

JIRA KPI reporting

ServiceClarity for Agile Software Development

Select best-practice KPIs, set targets and automate KPI reporting to understand and improve the effectiveness of agile software development processes.

JIRA KPI reporting

ServiceClarity for Customer Support

Select best-practice KPIs, set targets and automate KPI reporting to gain key insights and drive a top-tier customer support service to your customers.

previous arrow
next arrow
Slider

Powerful automated KPI reporting for fast growing technology companies

ServiceClarity is for technology leaders and DevOps Managers to track best-practice KPIs, view targets and automate KPI reporting in order to understand, improve and optimise the effectiveness of their processes.

ServiceClarity cloud connectors

CONNECT

Connect operational systems with ServiceClarity Cloud Integrations

Select ServiceClarity best practice KPIs

SELECT

Choose best practice KPIs from the ServiceClarity KPI library

ServiceClarity KPI Reporting

REPORT

Automate metric reporting through ServiceClarity Dashboards

ServiceClarity can be rapidly configured to monitor
cloud services and internal systems

ZendeskAWS cost reportingSalesforceJIRA Executive ReportingJIRA ServiceDesk SLA ReportingPingdomHubSpot KPI sales reportingMavenlink Time ReportingXero Financial KPI Reporting

New DevOps Reporting Ebook – Pragmatic Reporting for DevOps Managers Download Now

ServiceClarity KPI Reporting

Measure the KPIs that matter across multiple connectors and KPI report types,
tracking business processes and cost to answer key efficiency questions.
jira bug report Bug Report
  • Mean Time to Resolve Bugs
  • % Critical Bugs
  • % Bugs Found Post Release
  • Bug Burndown (Opened vs Closed)
jira velocity reportVelocity Report
  • Bugs Resolved
  • Story Points Closed
  • Bugs Found vs Fixed
  • Stories Opened vs Closed
jira remaining effort reportRemaining Effort Report
  • Days Remaining
  • Bugs Remaining
  • Stories Remaining
  • Story Points Remaining
jira cost report Cost Report
  • Support Costs
  • Bug Fix Costs
  • Testing Costs
  • Development Costs
jira revenue report Revenue Report
  • Lost Revenue
  • Profit
  • Revenue
  • % Time Chargeable
time report Time Report
  • % Time on Unplanned Activities
  • % Time on High Priority Bugs
  • % Time on High Priority Stories
  • % Time on User Stories
jira status report Priority Report
  • % of Senior Developer Time on High Priority Defects
  • % of Senior Developer Time on High Priority Stories
Agile Software Development reportSoftware Quality Report
  • % Bugs Reopened
  • Average Time Spent in Test
  • Number of Bugs per User Story
  • % Time Spent Fixing Bugs
AWS Usage reportBug Report
  • Mean Time to Resolve Bugs
  • % Critical Bugs
  • % Bugs Found Post Release
  • Bug Burndown (Opened vs Closed)
Velocity report - software developmentVelocity Report
  • Bugs Resolved
  • Story Points Closed
  • Bugs Found vs Fixed
  • Stories Opened vs Closed
Remaining Effort report - software developmentRemaining Effort Report
  • Days Remaining
  • Bugs Remaining
  • Stories Remaining
  • Story Points Remaining
Customer Support SLA reportSLA Report
  • % Right First Time
  • Mean Time to Respond
  • Mean Time To Resolve
  • % SLAs met
Customer Satisfaction reportCustomer Satisfaction Report
  • Reopened Customer Issues
  • % Defects Found by Customer
  • First Line Fix
  • First Time Fix
JIRA KPI reporting

ServiceClarity was able to provide me with greater insights into JIRA than any other reporting tool on the market. Within 5 days I was able to get a report that was custom to my development processes and start monitoring straight away.

customer testimonial

Dima Rastaturin

Head of Operations at Pindrop NL

JIRA KPI reporting

With ServiceClarity we can see all of our key metrics all the time. We can also more clearly see the relationships between the numbers and how pulling different levers can have a significant impact on performance.

customer testimonial

Andrew Fleury

CEO of Transpoco

previous arrow
next arrow
Slider

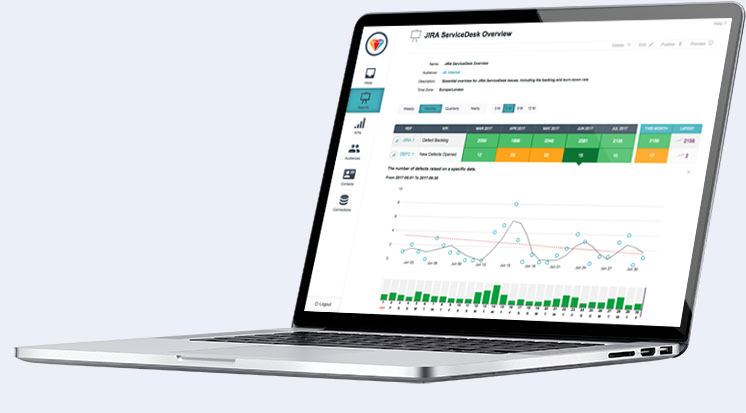
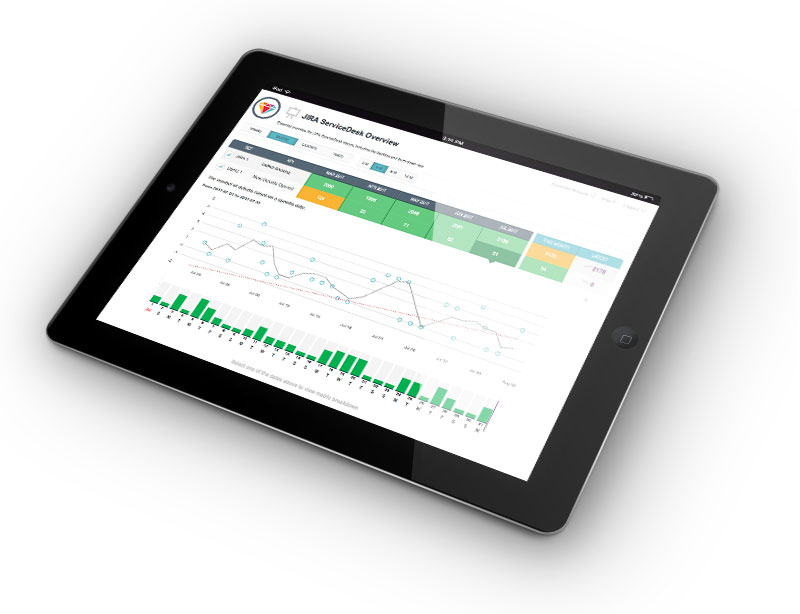
Business Value KPI Dashboard

Business value KPI dashboards that provide technology leaders and DevOps Managers real-time automated reporting on best-practice KPIs captured from multiple cloud service metrics.

Set targets and automate KPI reporting in order to understand the processes you need to improve.

By highlighting what is working and what is not through simple KPIs, and by identifying why through drill-down analysis, you gain the required insight to optimise your business processes.
Read More

Automated KPI reporting
Customer Metrics Dashboards - On-demand reports

Customer Dashboard

Share reports with partners and customers. This dashboard streamlines the KPI reporting process by eliminating the need for manual report generation, while improving customer satisfaction with instant access to on-demand reports that focus on the KPIs that matter, this dashboard communicates the business value of these processes to your customer.

View our customer dashboard demo to get an insight into ServiceClarity and how reports can be shared: Demo Customer Dashboard

Read More

ServiceClarity for your business

ServiceClarity allows managers to align business activities to the vision and strategy of the organisation, improve internal and external communications, and monitor organisation performance against strategic goals.

Key Benefits

  • – Improve development operations and customer satisfaction processes.
  • – Improve and optimise business processes.
  • – Make better strategic decisions.
  • – Increase profits.
  • – Empower decision makers & internal teams with meaningful reports.

Key Features

  • – Powerful automated real-time KPI reporting tool.
  • – Reports focus on agile software development, customer satisfaction and operations.
  • – Track & measure KPIs that are custom to your data.
  • – We connect into: Jira, ServiceDesk, AWS, Xero and many more.
  • – Rapidly configure and monitor cloud and internal systems.
  • – Provide dashboards for internal teams to monitor and track progress.
  • – Share reports with internal teams and other stakeholders.
  • – High-level KPI reporting with access to drill down into detail.

Download our Case Study – Optimising Processes with ServiceClarity KPIs Download Now